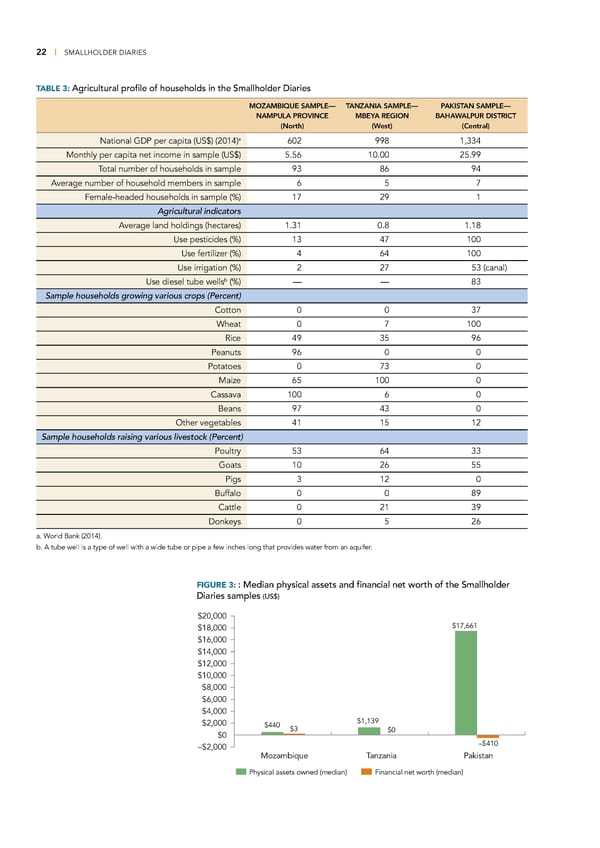
22 | SMALLHOLDER DIARIES TABLE 3: Agricultural profile of households in the Smallholder Diaries MOZAMBIQUE SAMPLE— TANZANIA SAMPLE— PAKISTAN SAMPLE— NAMPULA PROVINCE MBEYA REGION BAHAWALPUR DISTRICT (North) (West) (Central) a National GDP per capita (US$) (2014) 602 998 1,334 Monthly per capita net income in sample (US$) 5.56 10.00 25.99 Total number of households in sample 93 86 94 Average number of household members in sample 6 5 7 Female-headed households in sample (%) 17 29 1 Agricultural indicators Average land holdings (hectares) 1.31 0.8 1.18 Use pesticides (%) 13 47 100 Use fertilizer (%) 4 64 100 Use irrigation (%) 2 27 53 (canal) b Use diesel tube wells (%) — — 83 Sample households growing various crops (Percent) Cotton 0 0 37 Wheat 0 7 100 Rice 49 35 96 Peanuts 96 0 0 Potatoes 0 73 0 Maize 65 100 0 Cassava 100 6 0 Beans 97 43 0 Other vegetables 41 15 12 Sample households raising various livestock (Percent) Poultry 53 64 33 Goats 10 26 55 Pigs 3 12 0 Buffalo 0 0 89 Cattle 0 21 39 Donkeys 0 5 26 a. World Bank (2014). b. A tube well is a type of well with a wide tube or pipe a few inches long that provides water from an aquifer. FIGURE 3: : Median physical assets and financial net worth of the Smallholder Diaries samples (US$) $20,000 $18,000 $17,661 $16,000 $14,000 $12,000 $10,000 $8,000 $6,000 $4,000 $2,000 $440 $1,139 $0 $3 $0 –$2,000 –$410 Mozambique Tanzania Pakistan Physical assets owned (median) Financial net worth (median)
 Financial Diaries with Smallholder Families Page 33 Page 35