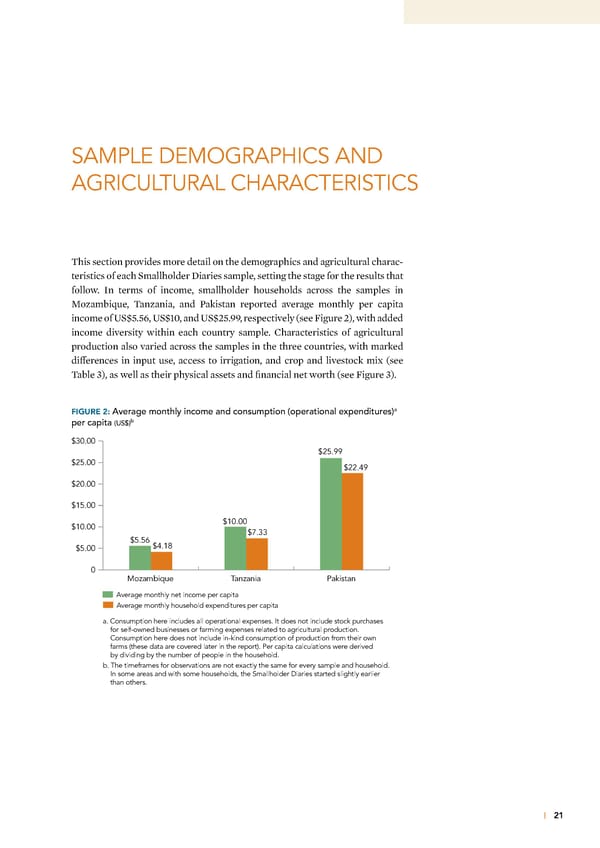
SAMPLE DEMOGRAPHICS AND AGRICULTURAL CHARACTERISTICS Œhis section provides more detail on the demographics and agricultural charac- teristics of each Smallholder ‰iaries sample, setting the stage for the results that follow €n terms of income, smallholder households across the samples in –o—ambiue, Œan—ania, and aistan reported average monthly per capita income of ©S±””¢, ©S±…’, and ©S±‘”žž, respectively (see igure ‘), with added income diversity within each country sample †haracteristics of agricultural production also varied across the samples in the three countries, with mared differences in input use, access to irrigation, and crop and livestoc mix (see Œable Ÿ), as well as their physical assets and financial net worth (see igure Ÿ) a FIGURE 2: Average monthly income and consumption (operational expenditures) per capita b (US$) $30.00 $25.99 $25.00 $22.49 $20.00 $15.00 $10.00 $10.00 $7.33 $5.56 $4.18 $5.00 0 Mozambique Tanzania Pakistan Average monthly net income per capita Average monthly household expenditures per capita a. Consumption here includes all operational expenses. It does not include stock purchases for self-owned businesses or farming expenses related to agricultural production. Consumption here does not include in-kind consumption of production from their own farms (these data are covered later in the report). Per capita calculations were derived by dividing by the number of people in the household. b. The timeframes for observations are not exactly the same for every sample and household. In some areas and with some households, the Smallholder Diaries started slightly earlier than others. | 21
 Financial Diaries with Smallholder Families Page 32 Page 34