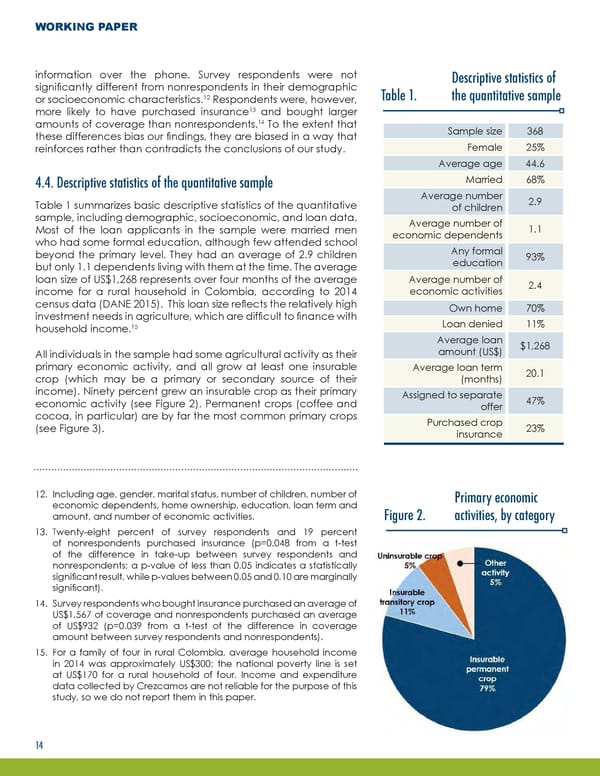
WORKING PAPER information over the phone. Survey respondents were not Descriptive statistics of significantly different from nonrespondents in their demographic 12 Table 1. the quantitative sample or socioeconomic characteristics. Respondents were, however, 13 more likely to have purchased insurance and bought larger 14 amounts of coverage than nonrespondents. To the extent that Sample size 368 these differences bias our findings, they are biased in a way that reinforces rather than contradicts the conclusions of our study. Female 25% Average age 44.6 4.4. Descriptive statistics of the quantitative sample Married 68% Table 1 summarizes basic descriptive statistics of the quantitative Average number 2.9 sample, including demographic, socioeconomic, and loan data. of children Most of the loan applicants in the sample were married men Average number of 1.1 who had some formal education, although few attended school economic dependents beyond the primary level. They had an average of 2.9 children Any formal 93% but only 1.1 dependents living with them at the time. The average education loan size of US$1,268 represents over four months of the average Average number of 2.4 income for a rural household in Colombia, according to 2014 economic activities census data (DANE 2015). This loan size reflects the relatively high Own home 70% investment needs in agriculture, which are difficult to finance with Loan denied 11% 15 household income. Average loan $1,268 All individuals in the sample had some agricultural activity as their amount (US$) primary economic activity, and all grow at least one insurable Average loan term 20.1 crop (which may be a primary or secondary source of their (months) income). Ninety percent grew an insurable crop as their primary Assigned to separate 47% economic activity (see Figure 2). Permanent crops (coffee and offer cocoa, in particular) are by far the most common primary crops Purchased crop (see Figure 3). insurance 23% 12. Including age, gender, marital status, number of children, number of Primary economic economic dependents, home ownership, education, loan term and amount, and number of economic activities. Figure 2. activities, by category 13. Twenty-eight percent of survey respondents and 19 percent of nonrespondents purchased insurance (p=0.048 from a t-test of the difference in take-up between survey respondents and nonrespondents; a p-value of less than 0.05 indicates a statistically significant result, while p-values between 0.05 and 0.10 are marginally significant). 14. Survey respondents who bought insurance purchased an average of US$1,567 of coverage and nonrespondents purchased an average of US$932 (p=0.039 from a t-test of the difference in coverage amount between survey respondents and nonrespondents). 15. For a family of four in rural Colombia, average household income in 2014 was approximately US$300; the national poverty line is set at US$170 for a rural household of four. Income and expenditure data collected by Crezcamos are not reliable for the purpose of this study, so we do not report them in this paper. 14
 Responsible Bundling of Microfinance Services Page 16 Page 18