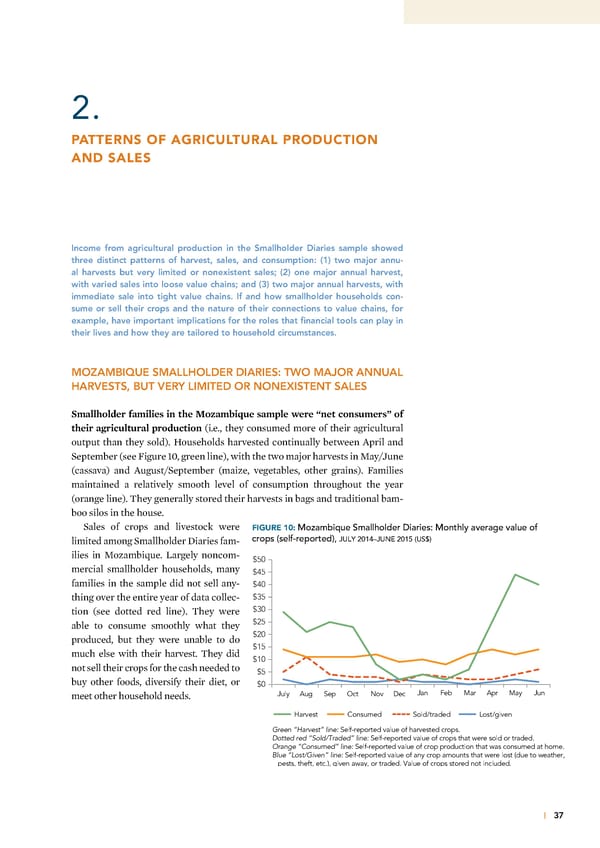
2. PATTERNS OF AGRICULTURAL PRODUCTION AND SALES Income from agricultural production in the Smallholder Diaries sample showed three distinct patterns of harvest, sales, and consumption: (1) two major annu- al harvests but very limited or nonexistent sales; (2) one major annual harvest, with varied sales into loose value chains; and (3) two major annual harvests, with immediate sale into tight value chains. If and how smallholder households con- sume or sell their crops and the nature of their connections to value chains, for example, have important implications for the roles that financial tools can play in their lives and how they are tailored to household circumstances. MOZAMBIQUE SMALLHOLDER DIARIES: TWO MAJOR ANNUAL HARVESTS, BUT VERY LIMITED OR NONEXISTENT SALES Smallholder families in the oambi ue sample were “net consumers” of their agricultural production (ie, they consumed more of their agricultural output than they sold) Households harvested continually between ˆpril and September (see igure …’, green line), with the two ma„or harvests in –ay¤Žune (cassava) and ˆugust¤September (mai—e, vegetables, other grains) amilies maintained a relatively smooth level of consumption throughout the year (orange line) Œhey generally stored their harvests in bags and traditional bam- boo silos in the house Sales of crops and livestoc were FIGURE 10: Mozambique Smallholder Diaries: Monthly average value of limited among Smallholder ‰iaries fam- crops (self-reported), JULY 2014–JUNE 2015 (US$) ilies in –o—ambiue ƒargely noncom- $50 mercial smallholder households, many $45 families in the sample did not sell any- $40 thing over the entire year of data collec- $35 tion (see dotted red line) Œhey were $30 able to consume smoothly what they $25 produced, but they were unable to do $20 much else with their harvest Œhey did $15 not sell their crops for the cash needed to $10 $5 buy other foods, diversify their diet, or $0 meet other household needs July Aug Sep Oct Nov Dec Jan Feb Mar Apr May Jun Harvest Consumed Sold/traded Lost/given Green “Harvest” line: Self-reported value of harvested crops. Dotted red “Sold/Traded” line: Self-reported value of crops that were sold or traded. Orange “Consumed” line: Self-reported value of crop production that was consumed at home. Blue “Lost/Given” line: Self-reported value of any crop amounts that were lost (due to weather, pests, theft, etc.), given away, or traded. Value of crops stored not included. | 37
 Financial Diaries with Smallholder Families Page 50 Page 52