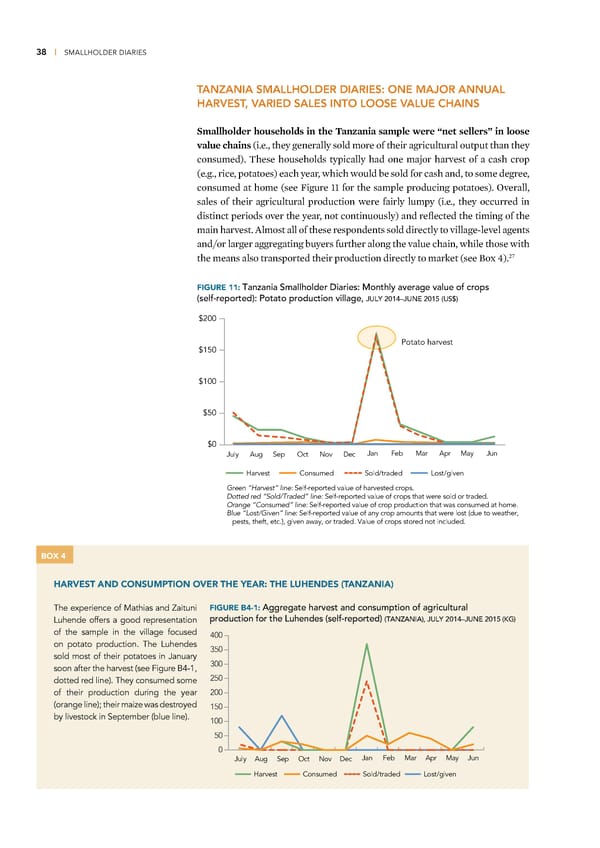
38 | SMALLHOLDER DIARIES BOX 3 TANZANIA SMALLHOLDER DIARIES: ONE MAJOR ANNUAL HARVEST, VARIED SALES INTO LOOSE VALUE CHAINS Smallholder households in the anania sample were “net sellers” in loose alue chains (ie, they generally sold more of their agricultural output than they consumed) Œhese households typically had one ma„or harvest of a cash crop (eg, rice, potatoes) each year, which would be sold for cash and, to some degree, consumed at home (see igure …… for the sample producing potatoes) ¦verall, sales of their agricultural production were fairly lumpy (ie, they occurred in distinct periods over the year, not continuously) and reflected the timing of the main harvest ˆlmost all of these respondents sold directly to village-level agents and¤or larger aggregating buyers further along the value chain, while those with ‘• the means also transported their production directly to maret (see £ox “) FIGURE 11: Tanzania Smallholder Diaries: Monthly average value of crops (self-reported): Potato production village, JULY 2014–JUNE 2015 (US$) $200 Potato harvest $150 $100 $50 $0 July Aug Sep Oct Nov Dec Jan Feb Mar Apr May Jun Harvest Consumed Sold/traded Lost/given Green “Harvest” line: Self-reported value of harvested crops. Dotted red “Sold/Traded” line: Self-reported value of crops that were sold or traded. Orange “Consumed” line: Self-reported value of crop production that was consumed at home. Blue “Lost/Given” line: Self-reported value of any crop amounts that were lost (due to weather, pests, theft, etc.), given away, or traded. Value of crops stored not included. BOX 4 HARVEST AND CONSUMPTION OVER THE YEAR: THE LUHENDES (TANZANIA) The experience of Mathias and Zaituni FIGURE B4-1: Aggregate harvest and consumption of agricultural Luhende offers a good representation production for the Luhendes (self-reported) (TANZANIA), JULY 2014–JUNE 2015 (KG) of the sample in the village focused 400 on potato production. The Luhendes 350 sold most of their potatoes in January 300 soon after the harvest (see Figure B4-1, dotted red line). They consumed some 250 of their production during the year 200 (orange line); their maize was destroyed 150 by livestock in September (blue line). 100 50 0 July Aug Sep Oct Nov Dec JanFeb Mar Apr MayJun Harvest Consumed Sold/tradedLost/given
 Financial Diaries with Smallholder Families Page 51 Page 53