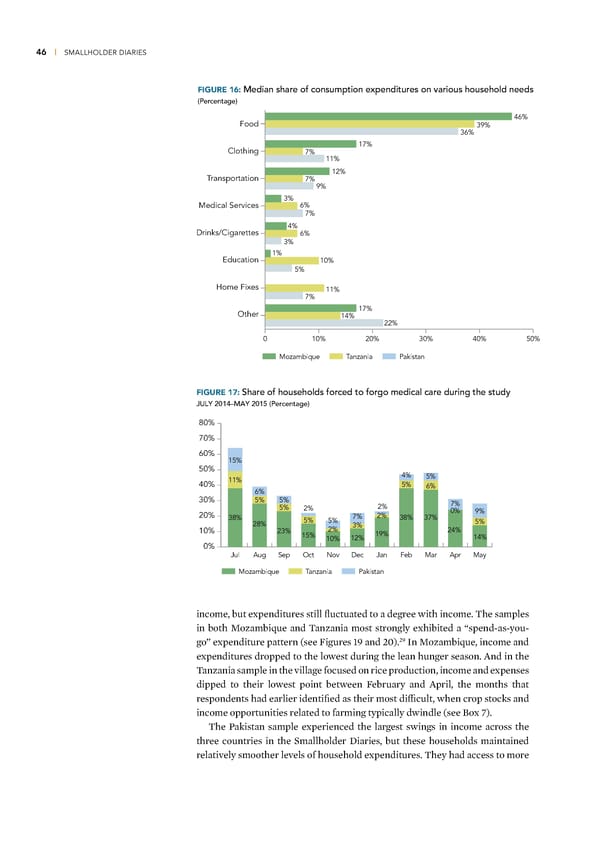
46 | SMALLHOLDER DIARIES FIGURE 16: Median share of consumption expenditures on various household needs (Percentage) Food 46% 39% 36% Clothing 17% 7% 11% Transportation 12% 7% 9% 3% Medical Services 6% 7% Drinks/Cigarettes 4% 6% 3% Education 1% 10% 5% Home Fixes 11% 7% Other 17% 14% 22% 0 10% 20% 30% 40% 50% Mozambique Tanzania Pakistan FIGURE 17: Share of households forced to forgo medical care during the study JULY 2014–MAY 2015 (Percentage) 80% 70% 60% 15% 50% 4% 11% 5% 40% 5% 6% 6% 30% 5% 5% 7% 5% 2% 2% 0% 9% 20% 38% 5% 5% 7% 2% 38%37% 5% 10% 28% 2% 3% 24% 23% 15% 19% 14% 10% 12% 0% JulAug Sep Oct Nov Dec Jan Feb Mar Apr May Mozambique Tanzania Pakistan income, but expenditures still fluctuated to a degree with income Œhe samples in both –o—ambiue and Œan—ania most strongly exhibited a “spend-as-you- ‘ž go” expenditure pattern (see igures …ž and ‘’) €n –o—ambiue, income and expenditures dropped to the lowest during the lean hunger season ˆnd in the Œan—ania sample in the village focused on rice production, income and expenses dipped to their lowest point between ebruary and ˆpril, the months that respondents had earlier identified as their most difficult, when crop stocs and income opportunities related to farming typically dwindle (see £ox •) Œhe aistan sample experienced the largest swings in income across the three countries in the Smallholder ‰iaries, but these households maintained relatively smoother levels of household expenditures Œhey had access to more
 Financial Diaries with Smallholder Families Page 60 Page 62