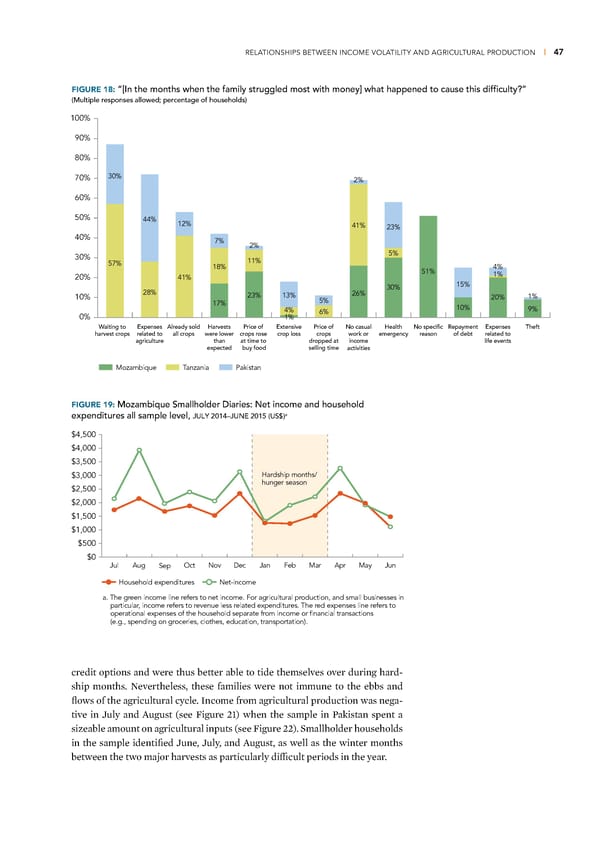
RELATIONSHIPS BETWEEN INCOME VOLATILITY AND AGRICULTURAL PRODUCTION | 47 FIGURE 18: “[In the months when the family struggled most with money] what happened to cause this difficulty?” (Multiple responses allowed; percentage of households) 100% 90% 80% 70% 30% 2% 60% 50% 44% 12% 41% 23% 40% 7% 2% 30% 5% 57% 18% 11% 4% 20% 41% 51% 1% 30% 15% 10% 28% 23% 13% 26% 20% 1% 17% 5% 4% 6% 10% 9% 0% 1% Waiting to Expenses Already sold Harvests Price of Extensive Price of No casual Health No specific Repayment Expenses Theft harvest crops related to all crops were lower crops rose crop loss crops work or emergency reason of debt related to agriculture than at time to dropped at income life events expected buy food selling time activities Mozambique Tanzania Pakistan FIGURE 19: Mozambique Smallholder Diaries: Net income and household a expenditures all sample level, JULY 2014–JUNE 2015 (US$) $4,500 $4,000 $3,500 $3,000 Hardship months/ $2,500 hunger season $2,000 $1,500 $1,000 $500 $0 JulAug Sep OctNov DecJan FebMar Apr MayJun Household expenditures Net-income a. The green income line refers to net income. For agricultural production, and small businesses in particular, income refers to revenue less related expenditures. The red expenses line refers to operational expenses of the household separate from income or financial transactions pending on groceries, clothes, education, transportation). (e.g., s credit options and were thus better able to tide themselves over during hard- ship months ˜evertheless, these families were not immune to the ebbs and flows of the agricultural cycle €ncome from agricultural production was nega- tive in Žuly and ˆugust (see igure ‘…) when the sample in aistan spent a si—eable amount on agricultural inputs (see igure ‘‘) Smallholder households in the sample identified Žune, Žuly, and ˆugust, as well as the winter months between the two ma„or harvests as particularly difficult periods in the year
 Financial Diaries with Smallholder Families Page 61 Page 63