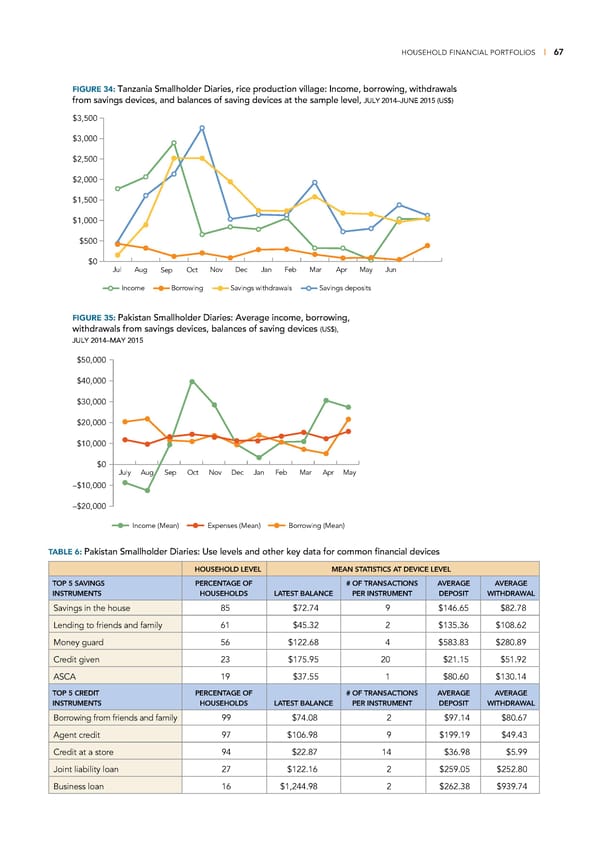
HOUSEHOLD FINANCIAL PORTFOLIOS | 67 FIGURE 34: Tanzania Smallholder Diaries, rice production village: Income, borrowing, withdrawals from savings devices, and balances of saving devices at the sample level, JULY 2014–JUNE 2015 (US$) $3,500 $3,000 $2,500 $2,000 $1,500 $1,000 $500 $0 JulAug Sep Oct NovDec JanFeb Mar Apr MayJun Income BorrowingSavings withdrawals Savings deposits FIGURE 35: Pakistan Smallholder Diaries: Average income, borrowing, withdrawals from savings devices, balances of saving devices (US$), JULY 2014–MAY 2015 $50,000 $40,000 $30,000 $20,000 $10,000 $0 July AugOSep ct Nov Dec Jan Feb Mar Apr May –$10,000 –$20,000 Income (Mean) Expenses (Mean) Borrowing (Mean) TABLE 6: Pakistan Smallholder Diaries: Use levels and other key data for common financial devices HOUSEHOLD LEVEL MEAN STATISTICS AT DEVICE LEVEL TOP 5 SAVINGS PERCENTAGE OF # OF TRANSACTIONS AVERAGE AVERAGE INSTRUMENTS HOUSEHOLDS LATEST BALANCE PER INSTRUMENT DEPOSIT WITHDRAWAL Savings in the house 85 $72.74 9 $146.65 $82.78 Lending to friends and family 61 $45.32 2 $135.36 $108.62 Money guard 56 $122.68 4 $583.83 $280.89 Credit given 23 $175.95 20 $21.15 $51.92 ASCA 19 $37.55 1 $80.60 $130.14 TOP 5 CREDIT PERCENTAGE OF # OF TRANSACTIONS AVERAGE AVERAGE INSTRUMENTS HOUSEHOLDS LATEST BALANCE PER INSTRUMENT DEPOSIT WITHDRAWAL Borrowing from friends and family 99 $74.08 2 $97.14 $80.67 Agent credit 97 $106.98 9 $199.19 $49.43 Credit at a store 94 $22.87 14 $36.98 $5.99 Joint liability loan 27 $122.16 2 $259.05 $252.80 Business loan 16 $1,244.98 2 $262.38 $939.74
 Financial Diaries with Smallholder Families Page 83 Page 85