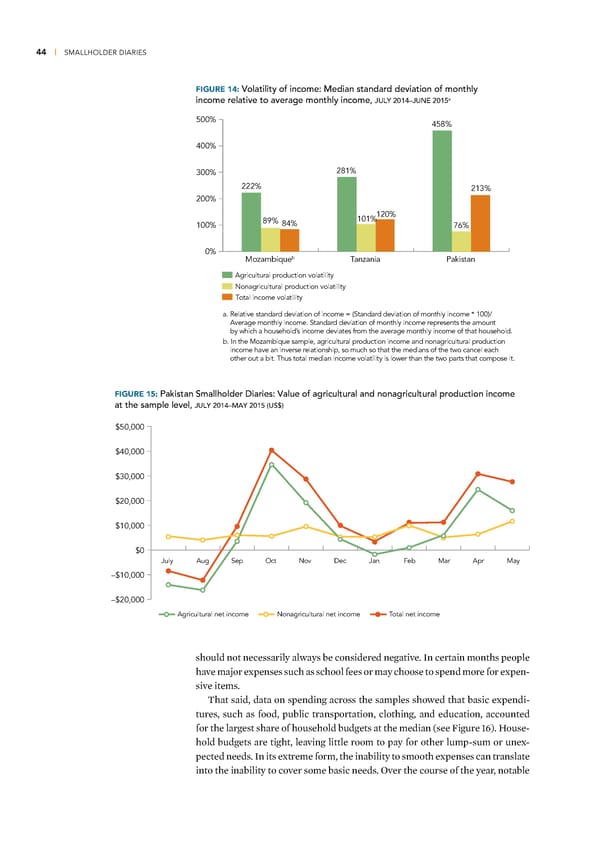
44 | SMALLHOLDER DIARIES FIGURE 14: Volatility of income: Median standard deviation of monthly income relative to average monthly income, a JULY 2014–JUNE 2015 500% 458% 400% 300% 281% 222% 213% 200% 120% 100% 89% 84% 101% 76% 0% b Tanzania Pakistan Mozambique Agricultural production volatility Nonagricultural production volatility Total income volatility a. Relative standard deviation of income = (Standard deviation of monthly income * 100)/ Average monthly income. Standard deviation of monthly income represents the amount by which a household’s income deviates from the average monthly income of that household. b. In the Mozambique sample, agricultural production income and nonagricultural production income have an inverse relationship, so much so that the medians of the two cancel each other out a bit. Thus total median income volatility is lower than the two parts that compose it. FIGURE 15: Pakistan Smallholder Diaries: Value of agricultural and nonagricultural production income at the sample level, JULY 2014–MAY 2015 (US$) $50,000 $40,000 $30,000 $20,000 $10,000 $0 July Aug Sep Oct Nov Dec Jan Feb Mar Apr May –$10,000 –$20,000 Agricultural net income Nonagricultural net income Total net income should not necessarily always be considered negative €n certain months people have ma„or expenses such as school fees or may choose to spend more for expen- sive items Œhat said, data on spending across the samples showed that basic expendi- tures, such as food, public transportation, clothing, and education, accounted for the largest share of household budgets at the median (see igure …¢) House- hold budgets are tight, leaving little room to pay for other lump-sum or unex- pected needs €n its extreme form, the inability to smooth expenses can translate into the inability to cover some basic needs ¦ver the course of the year, notable
 Financial Diaries with Smallholder Families Page 58 Page 60