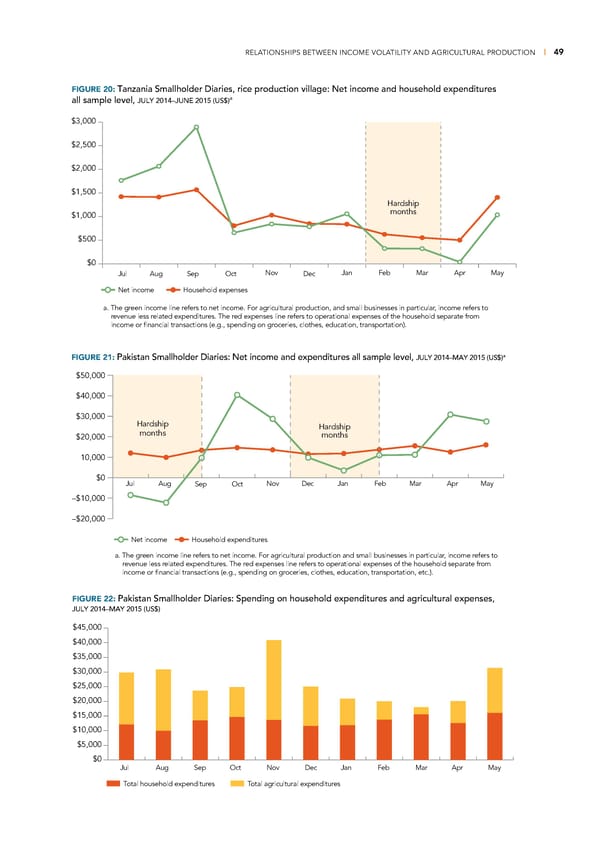
RELATIONSHIPS BETWEEN INCOME VOLATILITY AND AGRICULTURAL PRODUCTION | 49 FIGURE 20: Tanzania Smallholder Diaries, rice production village: Net income and household expenditures a all sample level, JULY 2014–JUNE 2015 (US$) $3,000 $2,500 $2,000 $1,500 Hardship $1,000 months $500 $0 JulAug SepOct Nov Dec JanFeb Mar Apr May Net income Household expenses a. The green income line refers to net income. For agricultural production, and small businesses in particular, income refers to revenue less related expenditures. The red expenses line refers to operational expenses of the household separate from income or financial transactions (e.g., spending on groceries, clothes, education, transportation). a FIGURE 21: Pakistan Smallholder Diaries: Net income and expenditures all sample level, JULY 2014–MAY 2015 (US$) $50,000 $40,000 $30,000 Hardship Hardship $20,000 months months 10,000 $0 JulAug Sep Oct NovDec JanFeb Mar Apr May –$10,000 –$20,000 Net income Household expenditures a. The green income line refers to net income. For agricultural production and small businesses in particular, income refers to revenue less related expenditures. The red expenses line refers to operational expenses of the household separate from income or financial transactions (e.g., spending on groceries, clothes, education, transportation, etc.). FIGURE 22: Pakistan Smallholder Diaries: Spending on household expenditures and agricultural expenses, JULY 2014–MAY 2015 (US$) $45,000 $40,000 $35,000 $30,000 $25,000 $20,000 $15,000 $10,000 $5,000 $0 Jul Aug Sep Oct Nov Dec Jan Feb Mar Apr May Total household expenditures Total agricultural expenditures
 Financial Diaries with Smallholder Families Page 63 Page 65